Particle size distribution describes the range and proportion of different particle sizes present within a ground or processed feed sample, rather than relying on a single average particle size figure alone, since two samples with the same average size can have very different distributions — one tightly clustered around the average, another spread widely from very fine to coarse particles.
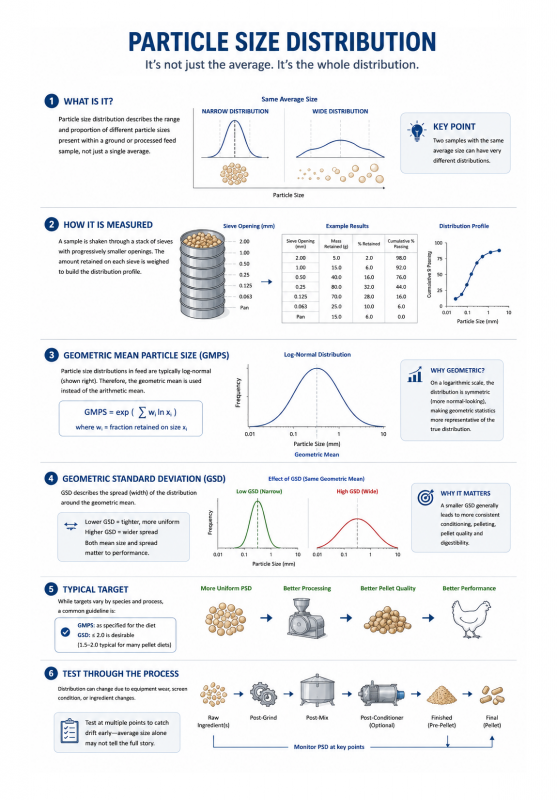
Particle size distribution is typically measured using a stack of sieves with progressively smaller openings, with the sample shaken through the sieve stack and the proportion retained on each sieve weighed to build a profile of the distribution, often summarized using statistical measures such as geometric mean particle size and geometric standard deviation.
Geometric mean particle size, rather than a simple arithmetic average, is the standard way particle size is summarized in feed milling, since particle size distributions in ground feed materials are typically log-normal in shape (more closely resembling a normal distribution when particle size is plotted on a logarithmic rather than linear scale), making geometric statistics more representative of the actual distribution than arithmetic statistics would be.
Geometric standard deviation describes the spread or width of the particle size distribution around the geometric mean, with a smaller geometric standard deviation indicating a more tightly clustered, uniform distribution and a larger value indicating a wider spread between fine and coarse particles within the same sample — this spread measure is often as important to processing and feeding outcomes as the mean particle size figure itself.
A narrower, more uniform particle size distribution is generally desirable in feed manufacturing, since it tends to produce more consistent conditioning and pelleting behavior, better pellet quality, and more predictable digestibility characteristics compared to a wide distribution containing a mix of very fine and coarse particles, even if both have the same average particle size.
Particle size distribution testing is typically performed not just on finished ground material but at multiple points through the process where relevant, since grinding equipment wear, screen condition, or upstream ingredient changes can all cause distribution to drift over time even when average particle size, checked in isolation, might appear to remain acceptable — making periodic full-distribution testing a more complete quality check than tracking average size alone.

 Bandırma, Turkey
 Jiaozuo City, China
 Esbjerg O, Denmark